Rating Graph is an online visualization tool which generates fancy graphs about TV shows and Movies based on 1348 million user ratings. Find your next binge-watch!
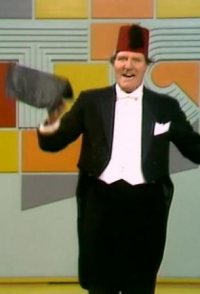
A show with jokes and failed attempt magic tricks done by Tommy Cooper,also in the program he dresses up like working people in everyday life and he dose mock interviews dressed up as historical figures.
Hint: you can examine a particular season more clearly on the graphs if you disable the trendline and all other seasons (via clicking on their labels).Episodes average ratingNote: season labels indicates the average rating per episode between the parentheses.Episodes total votesNote: season labels indicates the average votes per episode between the parentheses.History (tracking since March 7, 2020)Note: amount of total votes may decrease due to periodic removal of fraudulent ones.
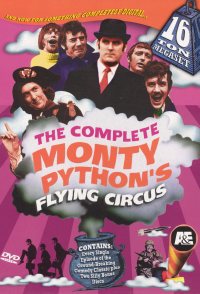 Monty Python's Flying Circus
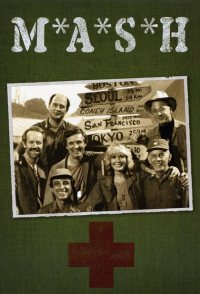 M*A*S*H
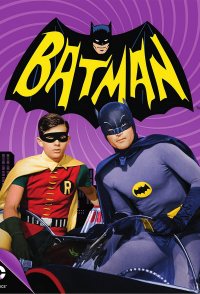 Batman
 The Persuaders!
 All in the Family
 The Mary Tyler Moore Show
 Are You Being Served?
 The Brady Bunch
 Monty Python's Fliegender Zirkus
 Dad's Army