Rating Graph is an online visualization tool which generates fancy graphs about TV shows and Movies based on 1348 million user ratings. Find your next binge-watch!
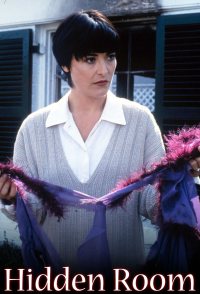
This half-hour anthology show usually featured a woman in hardship, musing about might-have-beens, or fighting for her life, such as a woman being visited by the ghost of the child she never had, a housewife discovering her own courage while battling a gang of thugs, a woman being visited by the romance novel hero in her head, or playing dangerous games of theft and sex with her own husband. In the third season, the format became more open-ended and generally Twilight-Zonish, such as the man who thinks he might be a werewolf.
Hint: you can examine a particular season more clearly on the graphs if you disable the trendline and all other seasons (via clicking on their labels).Episodes average ratingNote: season labels indicates the average rating per episode between the parentheses.Episodes total votesNote: season labels indicates the average votes per episode between the parentheses.History (tracking since March 7, 2020)Note: amount of total votes may decrease due to periodic removal of fraudulent ones.
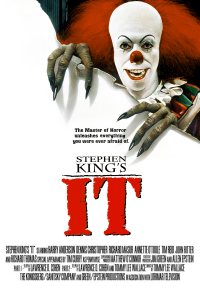 It
It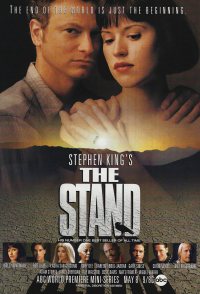 The Stand
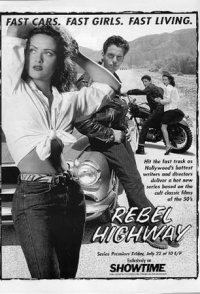 Rebel Highway
 Hotel Room
 Tous les garçons et les filles de leur âge...
 The Lion, the Witch & the Wardrobe
 Cuentos de Borges
 Freddy's Nightmares
 The Tommyknockers
 Nightmare Classics