
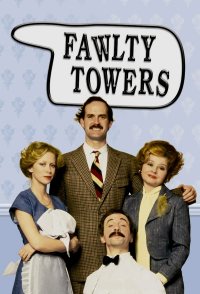
 Fawlty Towers
Total votes: 28,080
Average rating: 8.8
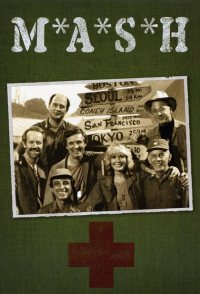 M*A*S*H
Total votes: 160,202
Average rating: 7.8
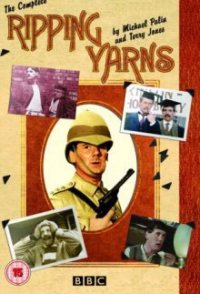 Ripping Yarns
Total votes: 3,298
Average rating: 7.9
 The Norman Conquests
Total votes: 518
Average rating: 8.7
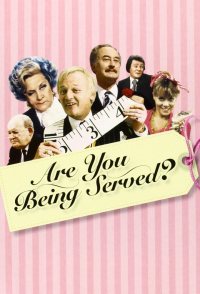 Are You Being Served?
Total votes: 14,420
Average rating: 7.6
 Three's Company
Total votes: 35,849
Average rating: 7.6
 Porridge
Total votes: 3,464
Average rating: 8.1
 WKRP in Cincinnati
Total votes: 16,217
Average rating: 7.9
 The Muppet Show
Total votes: 22,627
Average rating: 7.6
 Taxi
TaxiTotal votes: 22,201
Average rating: 7.4