Rating Graph is an online visualization tool which generates fancy graphs about TV shows and Movies based on 1358 million user ratings. Find your next binge-watch!
Based on Machiko Hasegawa's newspaper comic of the same name that started back in 1948, this series follows the day-to-day comedic activities of the extended Isono family: Fune and Namihei, their three children Sazae, Katsuo and Wakame, Sazae's husband Masuo Fuguta, and their child Tarao. The short episodes typically look at the lighter side of everyday life in Japan through the years: studying for exams, taking care of children, getting along with neighbors, bringing home a regular paycheck and keeping the house in decent shape.
Hint: you can examine a particular season more clearly on the graphs if you disable the trendline and all other seasons (via clicking on their labels).Episodes average ratingNote: season labels indicates the average rating per episode between the parentheses.Episodes total votesNote: season labels indicates the average votes per episode between the parentheses.History (tracking since March 7, 2020)Note: amount of total votes may decrease due to periodic removal of fraudulent ones.

 Columbo
 Monty Python's Flying Circus
 The Prisoner
 M*A*S*H
 Scooby Doo, Where Are You!
 Batman
 Night Gallery
 The Persuaders!
 All in the Family
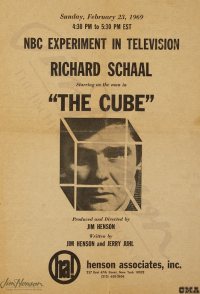 NBC Experiment in Television