Rating Graph is an online visualization tool which generates fancy graphs about TV shows and Movies based on 1348 million user ratings. Find your next binge-watch!
Jake, desperately trying to recover from the recent betrayal and the tragic death of his beloved fiancee, attempts a novel form of therapy to overcome his great loss. He advertises in the personals, under the pseudonym 'Red Shoes', to pay top dollar to women willing to send to him diaries of their similar experiences and how they overcame them. These are those diaries...
Hint: you can examine a particular season more clearly on the graphs if you disable the trendline and all other seasons (via clicking on their labels).Episodes average ratingNote: season labels indicates the average rating per episode between the parentheses.Episodes total votesNote: season labels indicates the average votes per episode between the parentheses.History (tracking since March 7, 2020)Note: amount of total votes may decrease due to periodic removal of fraudulent ones.

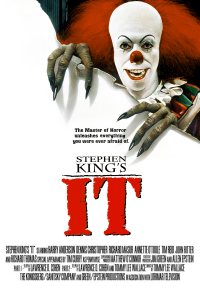 It
It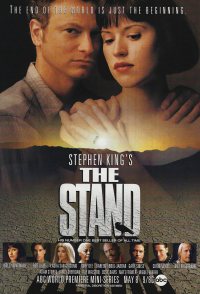 The Stand
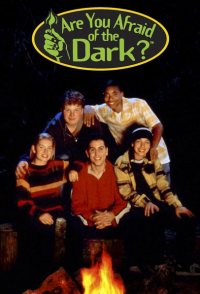 Are You Afraid of the Dark?
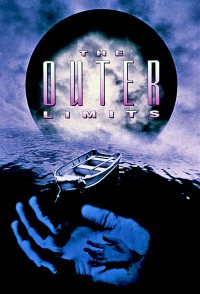 The Outer Limits
 Rebel Highway
 Hotel Room
 Tous les garçons et les filles de leur âge...
 Beverly Hills, 90210
 Chiller
 Cuentos de Borges