Rating Graph is an online visualization tool which generates fancy graphs about TV shows and Movies based on 1358 million user ratings. Find your next binge-watch!
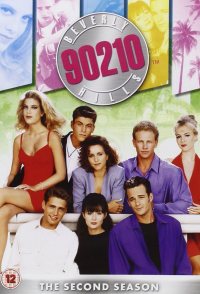
Originally based around the lives of a group of high school students living in the wealthy Beverly Hills neighborhood, then later moving on to their college days as they got older. The kids become friends and enemies, fall in and out of love, and go through an endless series of crises as this small group somehow becomes personally involved in every newsworthy social issue from alcoholism to South African apartheid to pregnancy to AIDS.
Hint: you can examine a particular season more clearly on the graphs if you disable the trendline and all other seasons (via clicking on their labels).Episodes average ratingNote: season labels indicates the average rating per episode between the parentheses.Episodes total votesNote: season labels indicates the average votes per episode between the parentheses.History (tracking since March 7, 2020)Note: amount of total votes may decrease due to periodic removal of fraudulent ones.
 The X-Files
 Poirot
 It
It The Case-Book of Sherlock Holmes
 Inspector Morse
 Prime Suspect
 Are You Afraid of the Dark?
 A Touch of Frost
 Law & Order
 Return to Lonesome Dove