Rating Graph is an online visualization tool which generates fancy graphs about TV shows and Movies based on 1348 million user ratings. Find your next binge-watch!
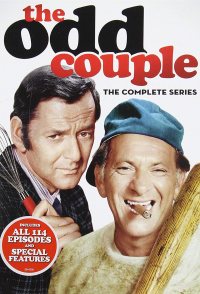
One is neat, one is a slob. Both are divorced and need a place to stay. That's how fussy photographer Felix Unger and sloppy sportswriter Oscar Madison end up sharing a New York City apartment. The arguments are endless but funny; it's like watching your parents fight.
Hint: you can examine a particular season more clearly on the graphs if you disable the trendline and all other seasons (via clicking on their labels).Episodes average ratingNote: season labels indicates the average rating per episode between the parentheses.Episodes total votesNote: season labels indicates the average votes per episode between the parentheses.History (tracking since March 7, 2020)Note: amount of total votes may decrease due to periodic removal of fraudulent ones.
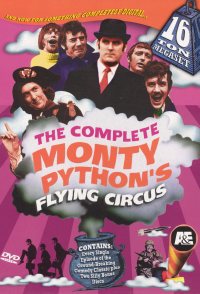 Monty Python's Flying Circus
 M*A*S*H
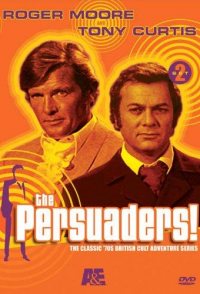 The Persuaders!
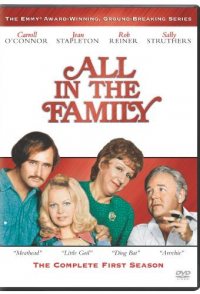 All in the Family
 The Mary Tyler Moore Show
 Are You Being Served?
 The Brady Bunch
 Monty Python's Fliegender Zirkus
 Dad's Army
 Emergency!