Rating Graph is an online visualization tool which generates fancy graphs about TV shows and Movies based on 1356 million user ratings. Find your next binge-watch!
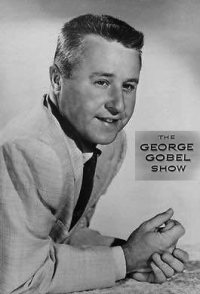
The George Gobel Show ratings (TV show, 1954-1960)
For Gobel's half-hour series, he used a successful comedy format of a monologue segment, followed by a story set up segment, then a musical interlude with the show's girl singer, then the main skit with the guest performers.
Hint: you can examine a particular season more clearly on the graphs if you disable the trendline and all other seasons (via clicking on their labels).Episodes average ratingNote: season labels indicates the average rating per episode between the parentheses.Episodes total votesNote: season labels indicates the average votes per episode between the parentheses.History (tracking since March 7, 2020)Note: amount of total votes may decrease due to periodic removal of fraudulent ones.
 Alfred Hitchcock Presents
 Leave It to Beaver
 Maverick
 Zorro
Zorro The Abbott and Costello Show
 Screen Directors Playhouse
 Father Knows Best
 The Phil Silvers Show
 Hallmark Hall of Fame
 Hancock's Half Hour